Timeline Chart
Overview
Displays events along a timeline, perfect for showing survey campaigns, project milestones, or customer journey events. Each event can have a start and end time with descriptive labels.
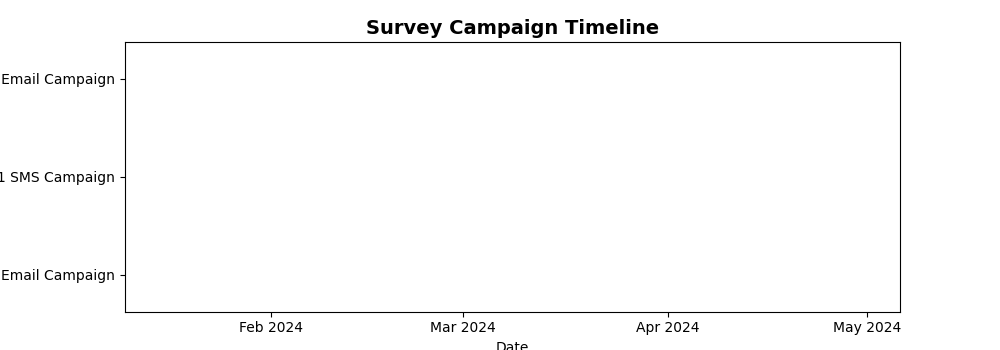
Sample Preview
Best Use Cases
- Survey Campaign Timeline - Show when different survey campaigns were active
- Customer Journey Events - Track touchpoints and interactions over time
- Project Milestones - Display survey project phases and deliverables
Sample Data Structure
AskRITA UniversalChartData
from askrita.sqlagent.formatters.DataFormatter import UniversalChartData
from datetime import datetime

timeline_data = UniversalChartData(
    type="timeline",
    title="Survey Campaign Timeline",
    datasets=[],  # Empty for timeline charts
    timeline_events=[
        {
            "id": "Q1_Email",
            "label": "Q1 Email Campaign",
            "start": int(datetime(2024, 1, 15).timestamp() * 1000),
            "end": int(datetime(2024, 2, 15).timestamp() * 1000)
        },
        {
            "id": "Q1_SMS",
            "label": "Q1 SMS Campaign",
            "start": int(datetime(2024, 1, 20).timestamp() * 1000),
            "end": int(datetime(2024, 2, 10).timestamp() * 1000)
        },
        {
            "id": "Q2_Email",
            "label": "Q2 Email Campaign",
            "start": int(datetime(2024, 4, 1).timestamp() * 1000),
            "end": int(datetime(2024, 5, 1).timestamp() * 1000)
        }
    ]
)
Google Charts Implementation
HTML Structure
<!DOCTYPE html>
<html>
<head>
    <script type="text/javascript" src="https://www.gstatic.com/charts/loader.js"></script>
</head>
<body>
    <div id="timeline_chart" style="width: 900px; height: 500px;"></div>
</body>
</html>
JavaScript Code
google.charts.load('current', {'packages':['timeline']});
google.charts.setOnLoadCallback(drawTimelineChart);

function drawTimelineChart() {
    var container = document.getElementById('timeline_chart');
    var chart = new google.visualization.Timeline(container);
    var dataTable = new google.visualization.DataTable();

    dataTable.addColumn({ type: 'string', id: 'Campaign' });
    dataTable.addColumn({ type: 'string', id: 'Name' });
    dataTable.addColumn({ type: 'date', id: 'Start' });
    dataTable.addColumn({ type: 'date', id: 'End' });

    dataTable.addRows([
        ['Email Campaigns', 'Q1 Customer Satisfaction', new Date(2024, 0, 15), new Date(2024, 1, 15)],
        ['Email Campaigns', 'Q2 NPS Survey', new Date(2024, 3, 1), new Date(2024, 4, 1)],
        ['Email Campaigns', 'Q3 Service Feedback', new Date(2024, 6, 15), new Date(2024, 7, 15)],

        ['SMS Campaigns', 'Q1 Quick Pulse', new Date(2024, 0, 20), new Date(2024, 1, 10)],
        ['SMS Campaigns', 'Q2 Post-Visit Survey', new Date(2024, 3, 10), new Date(2024, 4, 20)],
        ['SMS Campaigns', 'Q3 Mobile Experience', new Date(2024, 6, 20), new Date(2024, 7, 10)],

        ['Phone Campaigns', 'Annual Satisfaction Study', new Date(2024, 2, 1), new Date(2024, 2, 31)],
        ['Phone Campaigns', 'Deep Dive Interviews', new Date(2024, 8, 1), new Date(2024, 8, 30)]
    ]);

    var options = {
        title: 'Survey Campaign Timeline 2024',
        titleTextStyle: {
            fontSize: 18,
            bold: true
        },
        width: 900,
        height: 500,
        backgroundColor: 'white',
        colors: ['#4285f4', '#34a853', '#fbbc04', '#ea4335'],
        timeline: {
            groupByRowLabel: true,
            showRowLabels: true,
            showBarLabels: true,
            rowLabelStyle: {
                fontName: 'Arial',
                fontSize: 14,
                color: '#333'
            },
            barLabelStyle: {
                fontName: 'Arial',
                fontSize: 12,
                color: 'white'
            }
        }
    };

    chart.draw(dataTable, options);
}
React Implementation
import React, { useEffect, useRef } from 'react';

interface TimelineEvent {
    id: string;
    category: string;
    label: string;
    start: Date;
    end: Date;
}

interface TimelineChartProps {
    events: TimelineEvent[];
    title?: string;
    width?: number;
    height?: number;
    colors?: string[];
}

const TimelineChart: React.FC<TimelineChartProps> = ({
    events,
    title = "Timeline Chart",
    width = 900,
    height = 500,
    colors = ['#4285f4', '#34a853', '#fbbc04', '#ea4335']
}) => {
    const chartRef = useRef<HTMLDivElement>(null);

    useEffect(() => {
        if (!window.google || !chartRef.current) return;

        const dataTable = new google.visualization.DataTable();
        dataTable.addColumn({ type: 'string', id: 'Category' });
        dataTable.addColumn({ type: 'string', id: 'Label' });
        dataTable.addColumn({ type: 'date', id: 'Start' });
        dataTable.addColumn({ type: 'date', id: 'End' });

        const rows = events.map(event => [
            event.category,
            event.label,
            event.start,
            event.end
        ]);
        dataTable.addRows(rows);

        const options = {
            title: title,
            width: width,
            height: height,
            colors: colors,
            timeline: {
                groupByRowLabel: true,
                showRowLabels: true,
                showBarLabels: true
            }
        };

        const chart = new google.visualization.Timeline(chartRef.current);
        chart.draw(dataTable, options);
    }, [events, title, width, height, colors]);

    return <div ref={chartRef} style={{ width: `${width}px`, height: `${height}px` }} />;
};

export default TimelineChart;
Survey Data Examples
Customer Journey Timeline
// Customer touchpoints and survey events
function drawCustomerJourneyTimeline() {
    var dataTable = new google.visualization.DataTable();
    dataTable.addColumn({ type: 'string', id: 'Journey Stage' });
    dataTable.addColumn({ type: 'string', id: 'Event' });
    dataTable.addColumn({ type: 'date', id: 'Start' });
    dataTable.addColumn({ type: 'date', id: 'End' });

    dataTable.addRows([
        // Awareness Stage
        ['Awareness', 'Digital Ad Campaign', new Date(2024, 0, 1), new Date(2024, 0, 31)],
        ['Awareness', 'Social Media Campaign', new Date(2024, 0, 15), new Date(2024, 1, 15)],

        // Consideration Stage
        ['Consideration', 'Website Visit Survey', new Date(2024, 1, 1), new Date(2024, 1, 28)],
        ['Consideration', 'Email Nurture Campaign', new Date(2024, 1, 10), new Date(2024, 2, 10)],

        // Purchase Stage
        ['Purchase', 'Post-Purchase Survey', new Date(2024, 2, 1), new Date(2024, 2, 31)],
        ['Purchase', 'Transaction Feedback', new Date(2024, 2, 15), new Date(2024, 3, 15)],

        // Retention Stage
        ['Retention', 'Loyalty Program Survey', new Date(2024, 3, 1), new Date(2024, 5, 31)],
        ['Retention', 'Annual Satisfaction Study', new Date(2024, 4, 1), new Date(2024, 4, 30)]
    ]);

    var options = {
        title: 'Customer Journey Survey Timeline',
        colors: ['#1f77b4', '#ff7f0e', '#2ca02c', '#d62728'],
        timeline: {
            groupByRowLabel: true
        }
    };

    var chart = new google.visualization.Timeline(document.getElementById('timeline_chart'));
    chart.draw(dataTable, options);
}
Survey Project Timeline
// Project phases and milestones
function drawProjectTimeline() {
    var dataTable = new google.visualization.DataTable();
    dataTable.addColumn({ type: 'string', id: 'Phase' });
    dataTable.addColumn({ type: 'string', id: 'Task' });
    dataTable.addColumn({ type: 'date', id: 'Start' });
    dataTable.addColumn({ type: 'date', id: 'End' });

    dataTable.addRows([
        // Planning Phase
        ['Planning', 'Survey Design', new Date(2024, 0, 1), new Date(2024, 0, 15)],
        ['Planning', 'Question Development', new Date(2024, 0, 10), new Date(2024, 0, 25)],
        ['Planning', 'Stakeholder Review', new Date(2024, 0, 20), new Date(2024, 1, 5)],

        // Development Phase
        ['Development', 'Survey Programming', new Date(2024, 1, 1), new Date(2024, 1, 15)],
        ['Development', 'Testing & QA', new Date(2024, 1, 10), new Date(2024, 1, 20)],
        ['Development', 'Pilot Testing', new Date(2024, 1, 15), new Date(2024, 1, 28)],

        // Deployment Phase
        ['Deployment', 'Survey Launch', new Date(2024, 2, 1), new Date(2024, 2, 3)],
        ['Deployment', 'Data Collection', new Date(2024, 2, 1), new Date(2024, 3, 30)],
        ['Deployment', 'Monitoring & Support', new Date(2024, 2, 1), new Date(2024, 4, 15)],

        // Analysis Phase
        ['Analysis', 'Data Processing', new Date(2024, 4, 1), new Date(2024, 4, 15)],
        ['Analysis', 'Statistical Analysis', new Date(2024, 4, 10), new Date(2024, 4, 25)],
        ['Analysis', 'Report Generation', new Date(2024, 4, 20), new Date(2024, 5, 5)]
    ]);

    var options = {
        title: 'Customer Satisfaction Survey Project Timeline',
        height: 400,
        colors: ['#4285f4', '#34a853', '#fbbc04', '#ea4335']
    };

    var chart = new google.visualization.Timeline(document.getElementById('timeline_chart'));
    chart.draw(dataTable, options);
}
Multi-Channel Campaign Timeline
// Overlapping campaigns across different channels
function drawMultiChannelTimeline() {
    var dataTable = new google.visualization.DataTable();
    dataTable.addColumn({ type: 'string', id: 'Channel' });
    dataTable.addColumn({ type: 'string', id: 'Campaign' });
    dataTable.addColumn({ type: 'date', id: 'Start' });
    dataTable.addColumn({ type: 'date', id: 'End' });

    dataTable.addRows([
        // Email Channel
        ['Email', 'Welcome Series Survey', new Date(2024, 0, 1), new Date(2024, 11, 31)],
        ['Email', 'Quarterly NPS Survey', new Date(2024, 2, 1), new Date(2024, 2, 15)],
        ['Email', 'Post-Purchase Follow-up', new Date(2024, 0, 1), new Date(2024, 11, 31)],

        // SMS Channel
        ['SMS', 'Store Visit Survey', new Date(2024, 0, 1), new Date(2024, 11, 31)],
        ['SMS', 'Prescription Ready Alert', new Date(2024, 0, 1), new Date(2024, 11, 31)],
        ['SMS', 'Appointment Reminder Survey', new Date(2024, 2, 1), new Date(2024, 10, 30)],

        // Phone Channel
        ['Phone', 'Annual Satisfaction Study', new Date(2024, 8, 1), new Date(2024, 9, 30)],
        ['Phone', 'Customer Service Follow-up', new Date(2024, 0, 1), new Date(2024, 11, 31)],

        // In-App Channel
        ['In-App', 'Feature Feedback Survey', new Date(2024, 3, 1), new Date(2024, 8, 31)],
        ['In-App', 'App Rating Prompt', new Date(2024, 0, 1), new Date(2024, 11, 31)],

        // Web Channel
        ['Web', 'Exit Intent Survey', new Date(2024, 0, 1), new Date(2024, 11, 31)],
        ['Web', 'Cart Abandonment Survey', new Date(2024, 1, 1), new Date(2024, 10, 31)]
    ]);

    var options = {
        title: 'Multi-Channel Survey Campaign Timeline',
        height: 500,
        colors: ['#4285f4', '#34a853', '#fbbc04', '#ea4335', '#9467bd', '#8c564b']
    };

    var chart = new google.visualization.Timeline(document.getElementById('timeline_chart'));
    chart.draw(dataTable, options);
}
Advanced Features
Interactive Timeline with Events
function drawInteractiveTimeline() {
    var chart = new google.visualization.Timeline(document.getElementById('timeline_chart'));

    google.visualization.events.addListener(chart, 'select', function() {
        var selection = chart.getSelection();
        if (selection.length > 0) {
            var row = selection[0].row;
            var category = dataTable.getValue(row, 0);
            var event = dataTable.getValue(row, 1);
            var start = dataTable.getValue(row, 2);
            var end = dataTable.getValue(row, 3);

            showEventDetails(category, event, start, end);
        }
    });

    chart.draw(dataTable, options);
}

function showEventDetails(category, event, start, end) {
    const detailPanel = document.getElementById('event-details');
    const duration = Math.ceil((end - start) / (1000 * 60 * 60 * 24)); // Days

    detailPanel.innerHTML = `
        <div class="event-detail">
            <h4>${event}</h4>
            <p><strong>Category:</strong> ${category}</p>
            <p><strong>Start:</strong> ${start.toLocaleDateString()}</p>
            <p><strong>End:</strong> ${end.toLocaleDateString()}</p>
            <p><strong>Duration:</strong> ${duration} days</p>
            <button onclick="loadEventMetrics('${event}')">View Metrics</button>
        </div>
    `;
    detailPanel.style.display = 'block';
}
Timeline with Milestones
function drawTimelineWithMilestones() {
    var dataTable = new google.visualization.DataTable();
    dataTable.addColumn({ type: 'string', id: 'Type' });
    dataTable.addColumn({ type: 'string', id: 'Description' });
    dataTable.addColumn({ type: 'date', id: 'Start' });
    dataTable.addColumn({ type: 'date', id: 'End' });

    // Add regular events
    dataTable.addRows([
        ['Survey Campaign', 'Q1 Customer Satisfaction', new Date(2024, 0, 15), new Date(2024, 1, 15)],
        ['Survey Campaign', 'Q2 NPS Survey', new Date(2024, 3, 1), new Date(2024, 4, 1)],

        // Add milestone events (same start and end date)
        ['Milestone', 'Survey Launch', new Date(2024, 0, 15), new Date(2024, 0, 15)],
        ['Milestone', 'Mid-Campaign Review', new Date(2024, 0, 30), new Date(2024, 0, 30)],
        ['Milestone', 'Campaign Complete', new Date(2024, 1, 15), new Date(2024, 1, 15)],
        ['Milestone', 'Results Presentation', new Date(2024, 1, 28), new Date(2024, 1, 28)]
    ]);

    var options = {
        title: 'Survey Campaign with Key Milestones',
        colors: ['#4285f4', '#ea4335'], // Different colors for campaigns vs milestones
        timeline: {
            groupByRowLabel: true
        }
    };

    var chart = new google.visualization.Timeline(document.getElementById('timeline_chart'));
    chart.draw(dataTable, options);
}
Resource Allocation Timeline
function drawResourceTimeline() {
    var dataTable = new google.visualization.DataTable();
    dataTable.addColumn({ type: 'string', id: 'Resource' });
    dataTable.addColumn({ type: 'string', id: 'Assignment' });
    dataTable.addColumn({ type: 'date', id: 'Start' });
    dataTable.addColumn({ type: 'date', id: 'End' });

    dataTable.addRows([
        // Survey Team
        ['Survey Team', 'Q1 Design Phase', new Date(2024, 0, 1), new Date(2024, 0, 31)],
        ['Survey Team', 'Q1 Data Collection', new Date(2024, 1, 1), new Date(2024, 2, 15)],
        ['Survey Team', 'Q1 Analysis Phase', new Date(2024, 2, 16), new Date(2024, 3, 15)],

        // Data Analytics Team
        ['Analytics Team', 'Dashboard Development', new Date(2024, 0, 15), new Date(2024, 1, 28)],
        ['Analytics Team', 'Statistical Analysis', new Date(2024, 2, 1), new Date(2024, 3, 30)],
        ['Analytics Team', 'Reporting & Insights', new Date(2024, 3, 15), new Date(2024, 4, 15)],

        // IT Support Team
        ['IT Support', 'Platform Setup', new Date(2024, 0, 1), new Date(2024, 0, 15)],
        ['IT Support', 'Technical Monitoring', new Date(2024, 1, 1), new Date(2024, 2, 28)],
        ['IT Support', 'System Maintenance', new Date(2024, 2, 1), new Date(2024, 4, 30)]
    ]);

    var options = {
        title: 'Team Resource Allocation Timeline',
        colors: ['#4285f4', '#34a853', '#fbbc04']
    };

    var chart = new google.visualization.Timeline(document.getElementById('timeline_chart'));
    chart.draw(dataTable, options);
}
Key Features
- Event Duration - Shows start and end times for activities
- Category Grouping - Groups related events together
- Color Coding - Visual differentiation of event types
- Interactive Selection - Click handling for event details
- Overlapping Events - Handles concurrent activities
When to Use
✅ Perfect for: - Project timelines and schedules - Campaign planning and tracking - Resource allocation visualization - Event sequence analysis - Process flow timelines
❌ Avoid when: - Single point-in-time data - Quantitative comparisons needed - Hierarchical relationships - Too many overlapping events (cluttered)
Styling and Customization
// Custom styling options
var options = {
    title: 'Survey Campaign Timeline',
    backgroundColor: '#f8f9fa',
    colors: ['#007bff', '#28a745', '#ffc107', '#dc3545'],
    timeline: {
        groupByRowLabel: true,
        showRowLabels: true,
        showBarLabels: true,
        avoidOverlappingGridLines: false,
        rowLabelStyle: {
            fontName: 'Arial',
            fontSize: 14,
            color: '#495057',
            bold: true
        },
        barLabelStyle: {
            fontName: 'Arial',
            fontSize: 11,
            color: 'white'
        }
    },
    tooltip: {
        textStyle: {
            fontSize: 12
        }
    }
};